How to Get Started with DIY Home Network Monitoring
Network monitoring helps you gain visibility into what is happening on your network. There are plenty of good reasons to implement monitoring on your home WiFi network; for example, you may want to see what device is using up all your bandwidth, get an idea of what your kids are doing on the Internet, or check for zero-day malware infections that would evade detection by antivirus software. This guide will show you how to get started with a simple network monitoring setup using free software tools and relatively inexpensive hardware.
This post is geared toward home and sole proprietor business networks; if you have concerns about your enterprise network, contact LMG for Digital Forensics, Penetration Testing, and Advisory Services.
Getting Started: Hardware
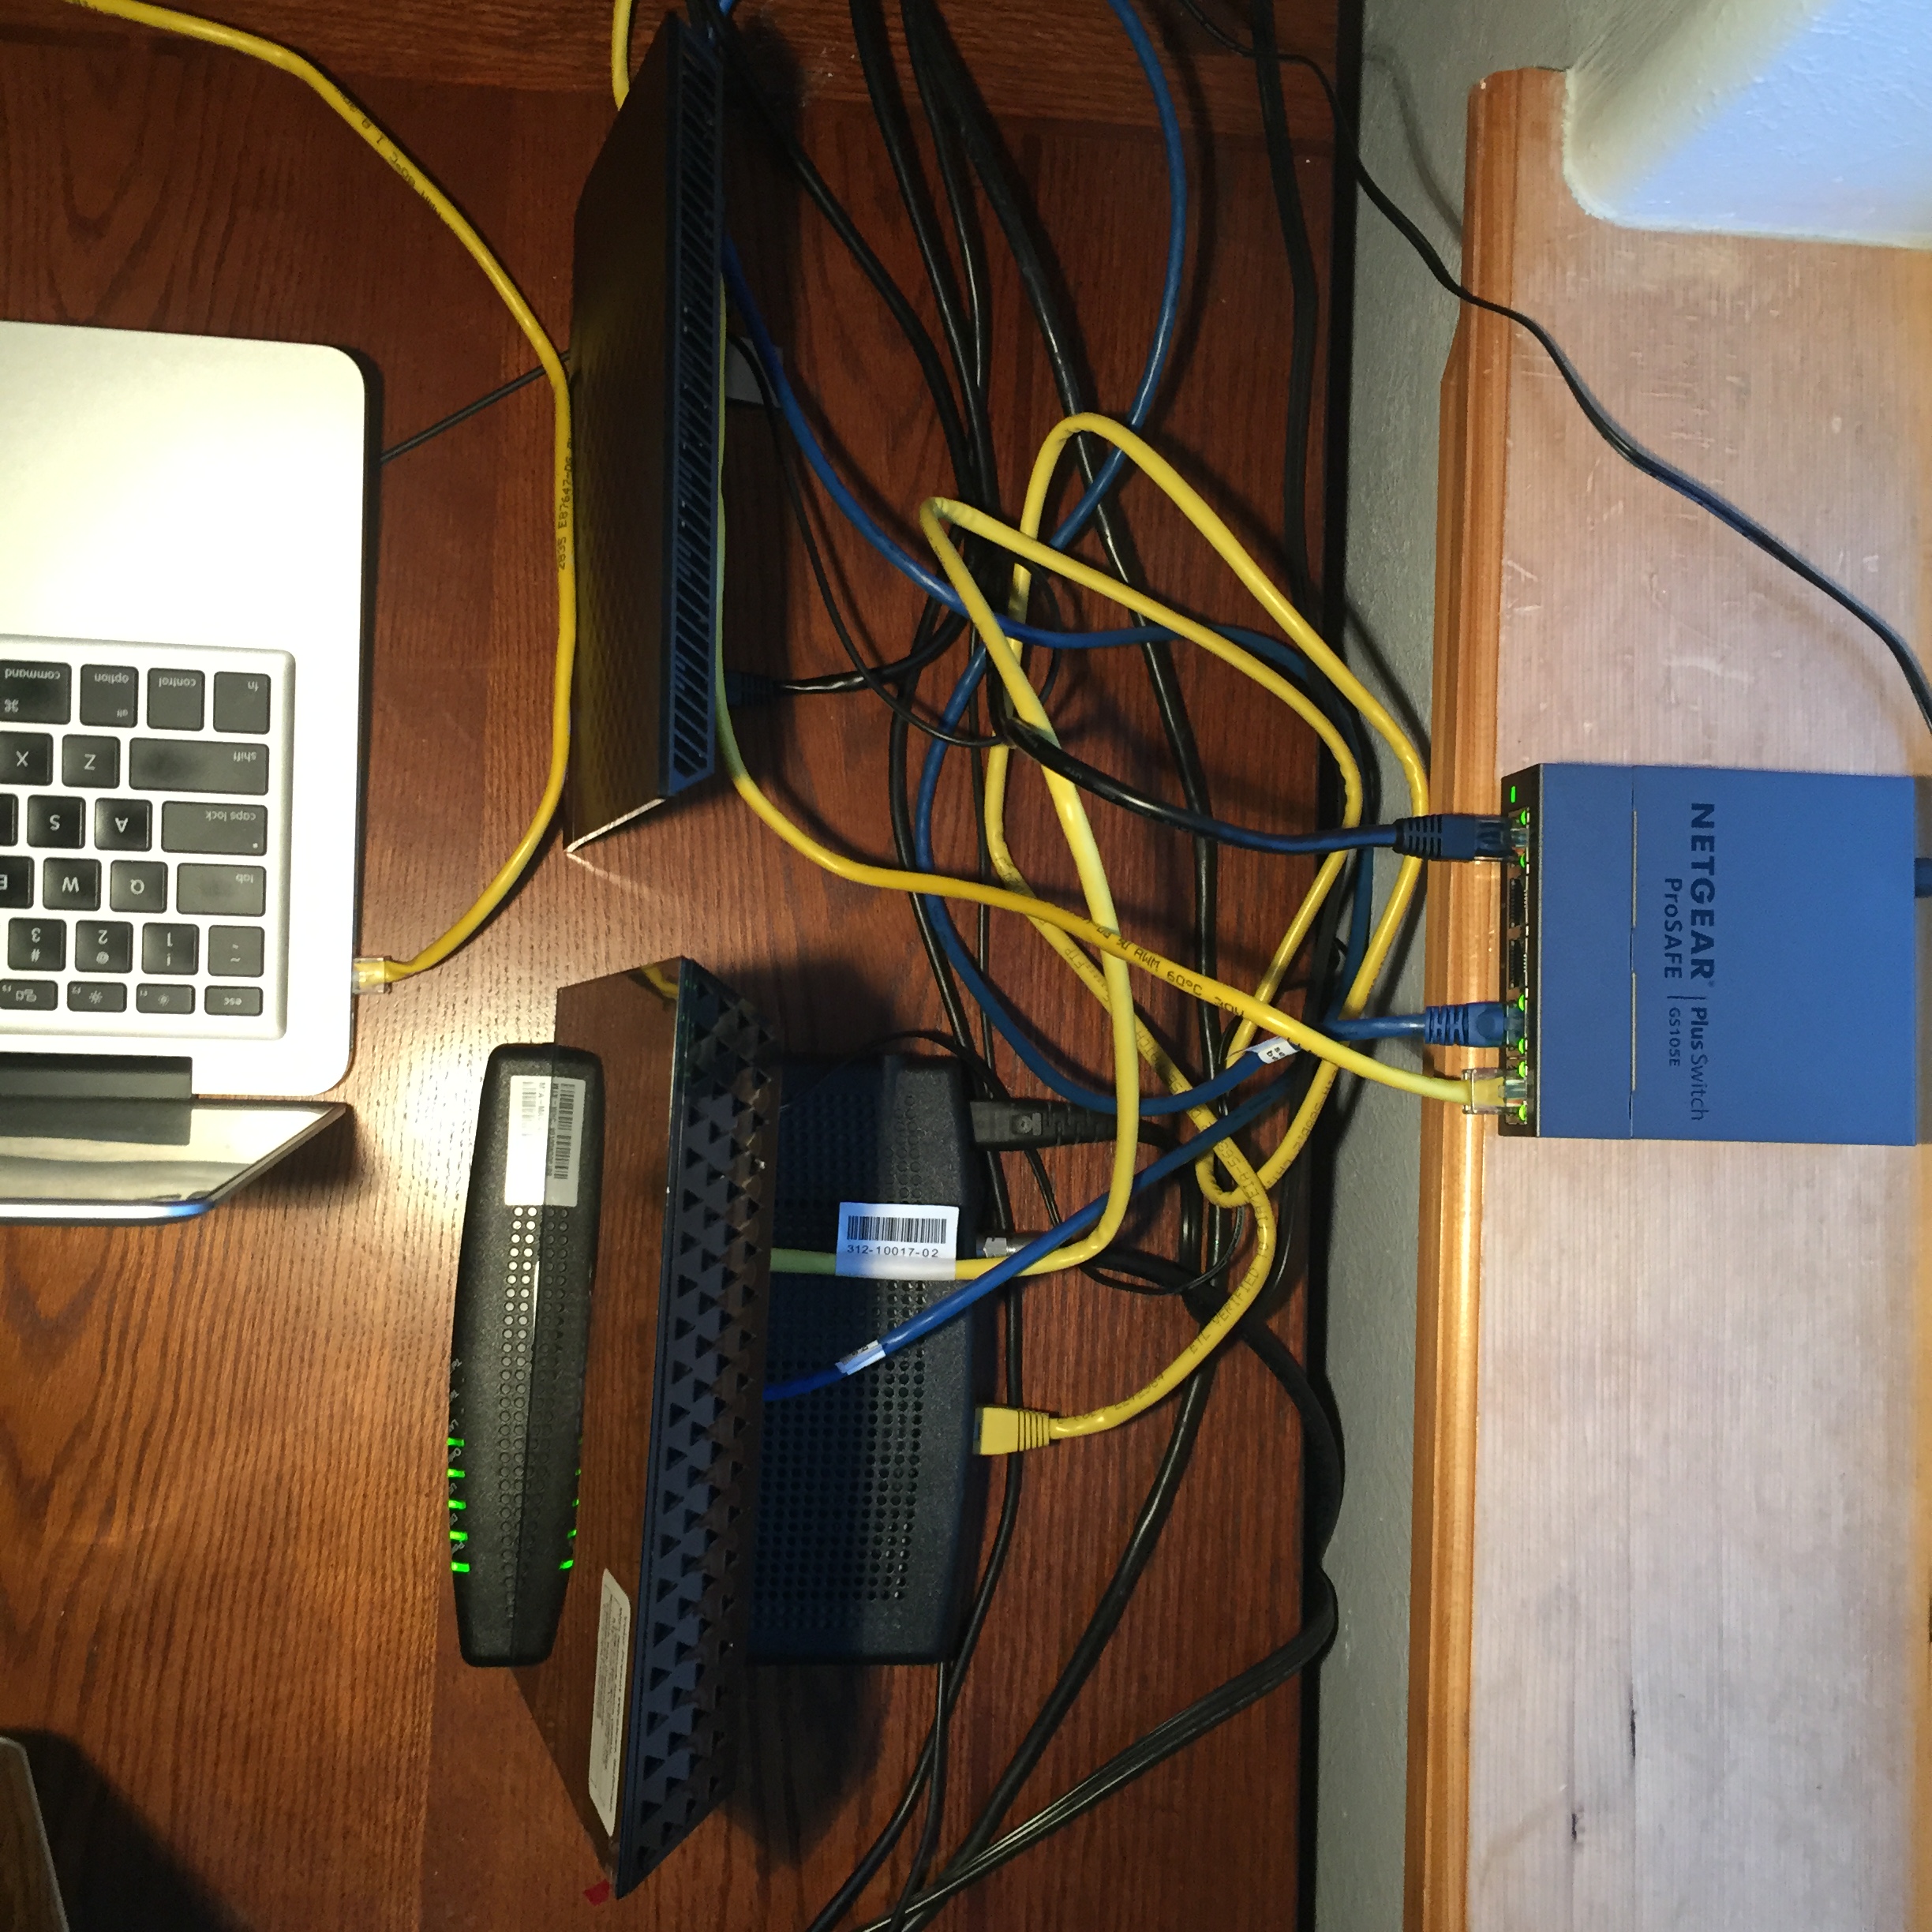
Infinite variations are possible, but for reference, this is the hardware I used:
![]()
![]() – ARRIS TM822A modem
– ARRIS TM822A modem
– NETGEAR R6300v2 wireless router
– ASUS RT-AC56R wireless router
– NETGEAR ProSAFE Plus GS105Ev2 switch
– MacBook laptop
Monitoring just one computer is straightforward, since it necessarily already has access to all of its own traffic: simply install some network monitoring tools on the machine, and you can see what it is doing on the network. Monitoring multiple machines in one centralized console requires a slightly more complicated setup, as I address in detail below. The main components that you may need to add to your wireless network setup to start monitoring are:
1) A computer with network monitoring tools installed (I used a MacBook laptop)
2) A network appliance with port mirroring capabilities, in order to send a copy of all the wireless traffic to your monitoring computer
Next Steps: Network Setup
The following steps will help get your own home network monitoring system up and running:
- Select a monitoring computer and install tools. Packet captures and flow records are two useful types of network monitoring data. A packet capture is a complete record of all datagrams being sent between the monitored devices. While it is useful to have packet captures on hand for completeness, they have a couple of major drawbacks: they occupy a lot of disk space, and since network traffic is increasingly encrypted, they are often unreadable. Flow records are a concise summary of network activity: they contain information like the source and destination IP addresses and ports, the protocol in use, and the total number of bytes and packets sent, but not full packet contents. It is like seeing who is talking to who and how often, without hearing their conversation – you can still gather a lot of useful information! On my monitoring laptop, I installed a couple of popular open-source tools: Wireshark for capturing and analyzing packets (also check out its command-line equivalent, tshark), and Argus and its related client tools for capturing and analyzing flow records. Tcpdump is another powerful, open-source packet analysis tool.
- Now that we have a few tools installed, configure the network to mirror packets to the monitoring laptop. Port mirroring, also known as Switched Port Analyzer (SPAN), simply means setting up one or more source ports to send a copy of every packet received to a designated destination port. We will plug the monitoring computer into the destination port so that it can see a copy of all packets on the network. Without port mirroring, packets would go straight to and from the wireless router, bypassing the monitoring computer. NETGEAR’s ProSAFE Plus GS105Ev2 switch is one option for setting up port mirroring. Some (higher-end) routers have built-in support for port mirroring, but the ones I used do not. Follow the documentation to set up port mirroring on your device of choice. On the NETGEAR GS105Ev2 switch, it was straightforward: access the switch through a web browser, select the ‘System’ tab, select ‘Monitoring’, then select ‘Mirroring’ in the menu on the left. Select ‘Enable’ in the ‘Mirroring’ dropdown menu, and designate a destination port. Then select one to four source ports – which must be different than the destination port – by checking the appropriate icons. Finally, hit ‘Apply.’

- Now that you have port mirroring set up, ensure that all your wired devices are connected properly. The devices from which you want to monitor traffic should be plugged into the mirroring source ports (in my case, the NETGEAR R6300v2 and ASUS RT-AC56R wireless routers), and an ethernet port on the monitoring computer should be plugged into the destination port. (If your monitoring computer lacks an ethernet port, like my MacBook Air, you can purchase an ethernet-to-USB adapter.) With this setup, two routers are necessary to force all packets through the mirroring switch. (The NETGEAR R6300v2 router is connected to the ARRIS modem and provides DHCP and NAT functionality; its wireless access point (WAP) functionality is not being used. The ASUS RT-AC56R router serves as the WAP for the devices being monitored.) To understand why two routers are required, consider what would happen if only the NETGEAR router was used. If the NETGEAR router on the perimeter was also being used as the WAP and the switch was placed inside the router, then packets would bypass the switch and go directly to the router. If the switch was placed in between the NETGEAR router and the modem, then monitoring tools would only see the public IP of the router instead of the more useful private IPs of the specific devices sending and receiving packets.
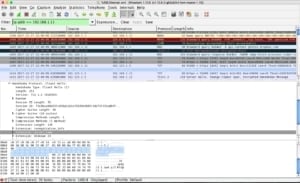
 Test your setup. To see if your monitoring system is successfully capturing traffic from all hosts on the network, and not just the monitoring computer itself, start up a tool like tcpdump on the appropriate ethernet (or USB to ethernet) interface and filter for TCP traffic unrelated to the IP address of your monitoring machine. I want to monitor on interface en4 and my laptop has the IP 192.168.1.12, so I run:
sudo tcpdump -i en4 'tcp and not host 192.168.1.12'
As long as packets match this filter, port mirroring is working.
Get Monitoring!
Start collecting and analyzing flow records. Packet captures take up enough space that you may only want to start them when you suspect a problem, but flow records are lean enough that you may want to collect them around the clock. Once Argus is installed, you can start the Argus server and leave it running in the background. Use ‘-i’ to specify the interface to monitor on and ‘-w’ to specify the output filename:
argus -i en4 -w ~/argus-out
Then you can use the Argus client tools to read the output file. The simplest is ra:
ra -r ~/argus-out
Optionally, you can add a filter (make sure you include two dashes before it):
ra -r ~/argus-out -- '<filter>'
I like to change a couple of Argus configuration variables in the support/Config/rarc file in the argus-clients-<version> directory. (Note that this file must be copied/moved to either ~/.rarc or $ARGUSHOME/.rarc to be read by the Argus clients.) I like to change RA_FIELD_SPECIFIER, which specifies the fields to print and their widths if not the default, and change RA_TIME_FORMAT to include the date:
RA_TIME_FORMAT="%Y-%m-%d %T.%f"

RA_FIELD_SPECIFIER="stime:20 dur proto saddr sport dir daddr dport pkts bytes state"
You can also put your configuration variables in a separate file and point to it using ‘-F’:
ra -F myRa.conf -r ~/argus-out
‘-n’ is another useful option and speeds up ra, since it tells ra to simply display port numbers instead of translating them to the corresponding service names.
To evaluate the reputability of IPs that hosts on your network are communicating with, you can use whois lookups, GeoIP databases like Maxmind’s (they have a free demo), or open-source blacklists like those maintained by The Spamhaus Project or FireHOL.
Good luck with your monitoring endeavors! Contact us at [email protected] if you have any comments or questions.